A comprehensive investigation of drought events is crucial to properly managing risks involved in the natural habitats and society. Moreover, nowadays with the changing climate, the frequency and intensity of drought events have increased dramatically. Hence, the need for studies aiming to discuss available drought indices and their ability to detect drought events seems higher than ever.
There are different meteorological and agricultural drought indices available in the literature for drought monitoring such as standardized precipitation index (SPI), standardized precipitation evapotranspiration index (SPEI), Palmer drought severity index (PDSI), standardized soil moisture index (SSMI), as well as normalized difference vegetation index (NDVI) and vegetation optical depth (VOD). Overall, each of these indices provide different information about the magnitude and areal extent of droughts over a region.
In case that we accept SSMI as our reference, a comparison of SPI and SPEI according to their linear association with SSMI shows that, globally, over 49% of pixels SPI, and over 30% of pixels SPEI show significantly better consistency with SSMI. Moreover, some more detailed analyses show that in regions with cooler temperatures and less and high vegetation cover density, the SPI provides a better correlation with SSMI, and over warmer regions, with a mid-range of vegetation density the SPEI can represent SSMI better (Figure 1).
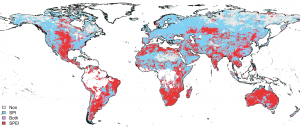
Figure 1: The best meteorological drought index that provides the highest correlation with SSMI.
Furthermore, if we consider the SPI as the main drought index to conclude that a meteorological drought has happened over a region, then the comparison of NDVI and VOD vegetation drought indices shows that each index might represent different aspect and view of drought. For example, over the Central Europe region, over 35% of the considered pixels NDVI, over 22% of VOD, and over 8% of both VIs anomalies have a significant response to drought events, while the significance level of these differences and the response time of vegetation indices vary with different land use and climate conditions (Figure 2).
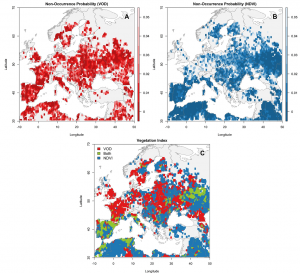
Figure 2: The non-occurrence probabilities of significant difference between the average values of VOD (A) and NDVI (B) vegetation indices anomalies during dry and wet periods. (C) represents the assigned vegetation indices based on the non-occurrence probabilities of VOD and NDVI vegetation indices.
For more information about this study please refer to the following published paper:
Afshar, M. H., Bulut, B., Duzenli, E., Amjad, M., & Yilmaz, M. T. (2022). Global spatiotemporal consistency between meteorological and soil moisture drought indices. Agricultural and Forest Meteorology, 316, 108848.
Afshar, M. H., Al-Yaari, A., & Yilmaz, M. T. (2021). Comparative evaluation of microwave L-band VOD and optical NDVI for agriculture drought detection over central Europe. Remote sensing, 13(7), 1251.